
The aim of this post is to improve the accessibility of the talks given at the 2nd Networking Event: Empowering Healthcare with Automated Analysis by providing with the notes used for the oral presentation.
A PDF copy of the slides can be downloaded from here
Introduction
Presentation
Hello everyone, after Carlos’ wonderful and thought-provoking talk I will try and present within mine and the collected efforts of the Integrated Pathology Unit towards building a platform for Integrative Discovery and Diagnosis in Cancer. My presenter notes and a copy of the slides can be found on the site by scanning this QR code here.
Background
So, to begin with let me talk a bit about myself. I did a bachelor’s in Biotechnology at the University of Barcelona, during the last year of which I actually came to London to work on my thesis. There I realised two things: first, that London was a wonderful place and that I wanted to stay there, secondly, that I found much more enjoyment analysing the data I was generating in the wet lab. It was then that I decided to pivot towards fully computational roles, doing a master’s in bioinformatics and theoretical systems biology at Imperial and a PhD in computational biology at UCL’s Cancer Institute. During my PhD I worked at Chris Tape’s lab towards understanding colorectal cancer biology and chemotherapy resistance using single-cell omic technologies and organoids as model. I worked on developing and publishing tools for mass cytometry data analysis, published a piece on the phenoscape of colonic stem cell regulation together with Xiao Qin (a former postdoc in Tape Lab that now leads her own lab in Oxford), and worked on exploring the use of knowledge graphs for capturing and interrogating cellular communications.
The Integrated Pathology Unit
Now as I introduced earlier, I am part of the Integrated Pathology Unit, together with my colleague Priya and having had the pleasure to host Carlos for his sabbatical from City during 2024. The IPU is actually a very unique setting, nestled in between the research-focused Institute of Cancer Research, and the clinically-focused Royal Marsden Hospital.
At the IPU we work not just with digital pathology images from different modalities, from H&E to IHC and multiplex immunofluorescence, but are also incorporating higher dimensional technologies like Celldive and spatial transcriptomics. All in all, there is a veritable wealth of data passing through the IPU, especially considering that we work with most types of solid tumour cancer, but as many of you here know, massive amounts of data don’t necessarily equate to knowledge. In our particular setting, this challenge is compounded by the need to work with this many data modalities, so are setting out to develop our own analysis platform, POPIDD.
POPIDD
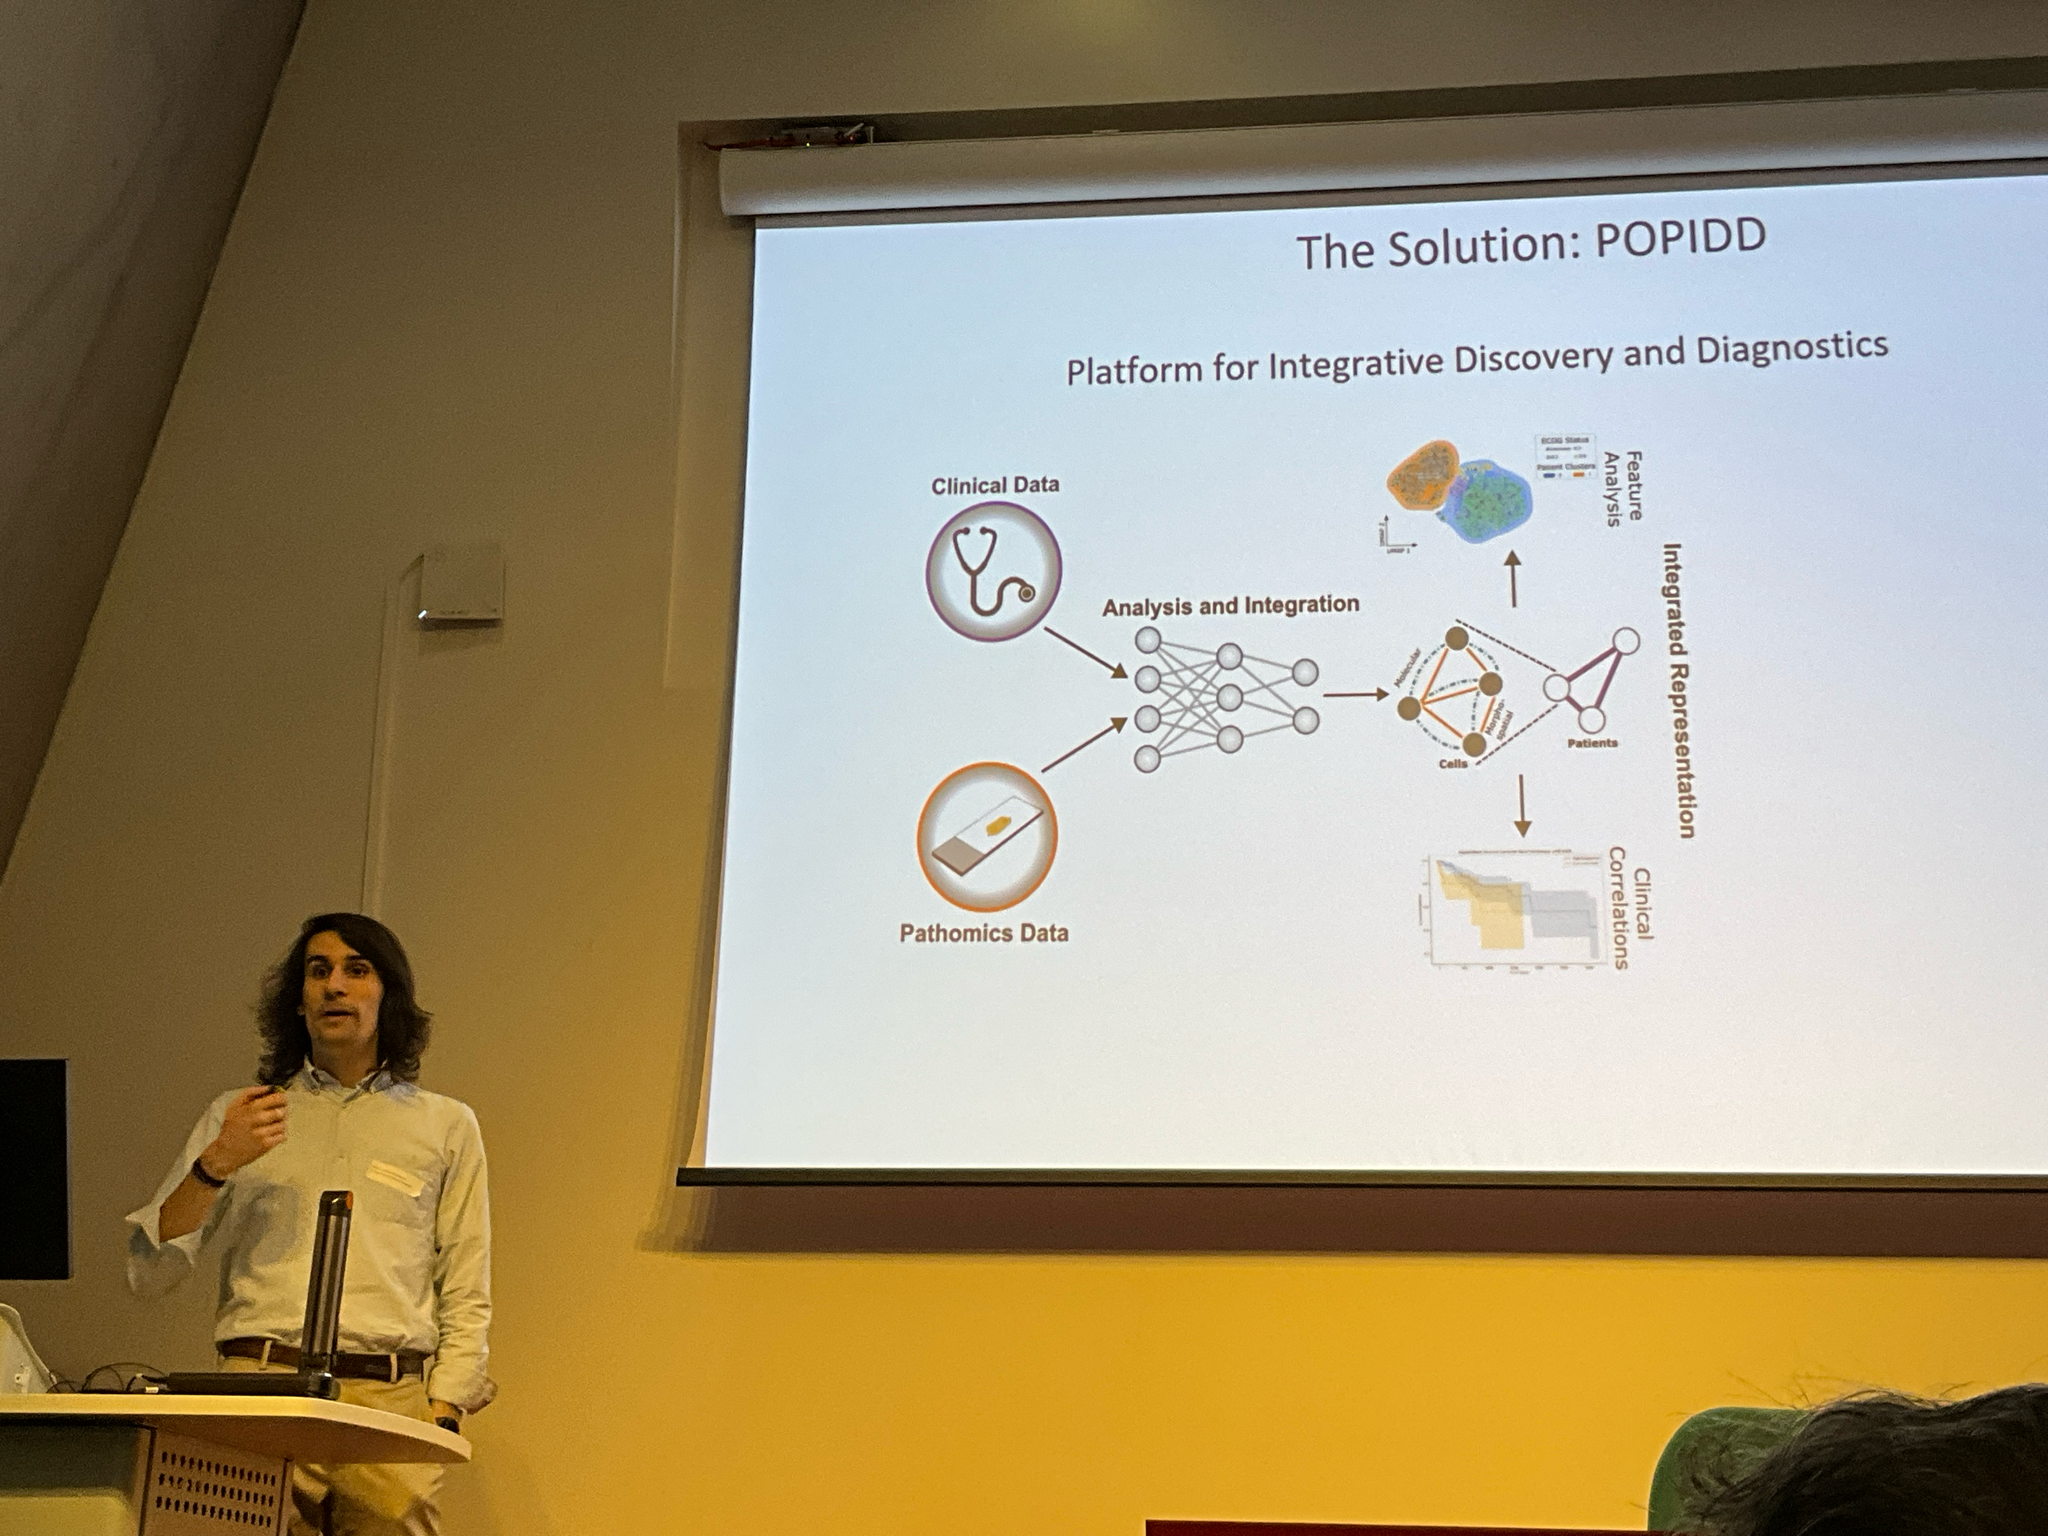
POPIDD, or Pathomics Platform for Integrative Discovery and Diagnostics represents our effort towards a solution able to work with not only the imaging modalities I just described, but also the associated clinical data so information can be extracted (including feature extraction and analysis) and integrated (using common data structures), ultimately leading to an increased understanding of clinical and biological processes. This is a growing framework centred around a modular backend (being developed almost exclusively in Python), so that we can consistently reuse in-house tools and also easily incorporate off-the-shelf models. Additionally, the IPU is a wet-lab heavy group, so being very conscious of the need for accessibility in empowering non-computational colleagues, we are also extending on the open source high-dimensional data viewer Napari to build an interface for POPIDD.
Backend
POPIDDs main pipeline remains unreleased beyond internal use for now, but elements like napari plugins and python packages (that can work either in a standalone way or as part of POPIDD) have already been released. See here popid-io, a napari plugin for reading digital pathology images and annotations as GeoJSONs and parquet files, or pyhscore, a simple package to compute pixel-wise H-scores. Again, as I mentioned earlier, we are focused on building accessible interfaces for these tools, so on the following slides I will show you some use cases of the custom napari interface accessible from POPIDD’s main pipeline.
Frontend
This is the interface, with custom widgets on the right. See for example on the upper right the batch loading popid-io widget, loading the shown mIF image, its channel metadata on the left, and adjusting the viewers scale bar. POPIDD’s interface incorporates a series of tabs for the different main components of the tool, we will begin here by talking about the tissue and cell segmentation tab, which uses both in-house and third party models. I also wanted to show here how we integrate standalone packages, in this case our own pyhscore package, that can be used to quickly quantify IHC images. Finally, there is also a module for aligning TMAs, so their cores can be mapped to the appropriate sample or patient ID before downstream analysis. The widget here uses the Python implementation of this pipeline, but those of you that came to CBIAS might remember how we also talked about a matlab version (perhaps a bit more performant than this one …) developed by Carlos.
Application on Epi700 cohort
I now wanted to take the last slide of my talk to show a real-life use case of POPIDD in the context of analysing a clinical colorectal cancer cohort. Some of you might find this familiar as it is very similar to the work I presented some months ago at CBIAS. Based on robust signal processing methods, TMAAP identifies the core layout on TMA slides and maps them to their relevant patient and sample IDs. Mapping alignment scores inform the confidence of the ID assignations, which can be visually inspected through a customised interface of the multi-dimensional image viewer napari. We validate TMAAP’s performance by applying it to the Epi700 colorectal cancer cohort, consisting of over 30 thousand individual immunohistochemistry (IHC) and H&E core images. TMAAP can accurately map these images to tumour and stromal samples for each patient. Following downstream IHC quantification, we then recapitulate known clinical and molecular features across all patients; including expected biological interactions between IHC targets and greater degrees of immune involvement in microsatellite instable and BRAF mutant tumours.
Closing remarks
Hopefully by now I have shown the idea that, not only is it crucial for us to develop, share, and use great tools advancing our research, but also that we have to be especially mindful of accessibility. Therefore, using graphical interfaces bypasses in my experience one of the main barriers to non-computational colleagues; the dreaded command line interface. I also wanted to take this time to highlight the IPU’s software repository, where myself, Priya and Carlos have been working on these tools and releasing some of them.
Thank you for your time and acknowledge all great people!